


Budget Reconciliation: State Child Welfare Impact Analysis
Child Welfare Wonk projects how each state fares...

Child Welfare & Budget Reconciliation
Congress is currently deliberating budget reconciliation legislation that could have significant implications for child welfare policy and financing.
As part of proposed spending reductions to offset tax policy changes, this simple-majority fast-track legislative procedure could create cuts to child welfare programs.
We have previously provided a primer on reconciliation and noted programs that could see significant cuts or elimination, which include:
Social Services Block Grant (SSBG);
Temporary Assistance for Needy Families (TANF); and
Medicaid.
A national perspective masks state-by-state variation. To project potential impact, Child Welfare Wonk modeled how these possible cuts could affect each state.
We built a projection model using data from three sources, which let us make a conservative estimate of how possible reconciliation cuts would impact each state.
Here’s a rundown of what we found for you, and the details on how we did it.
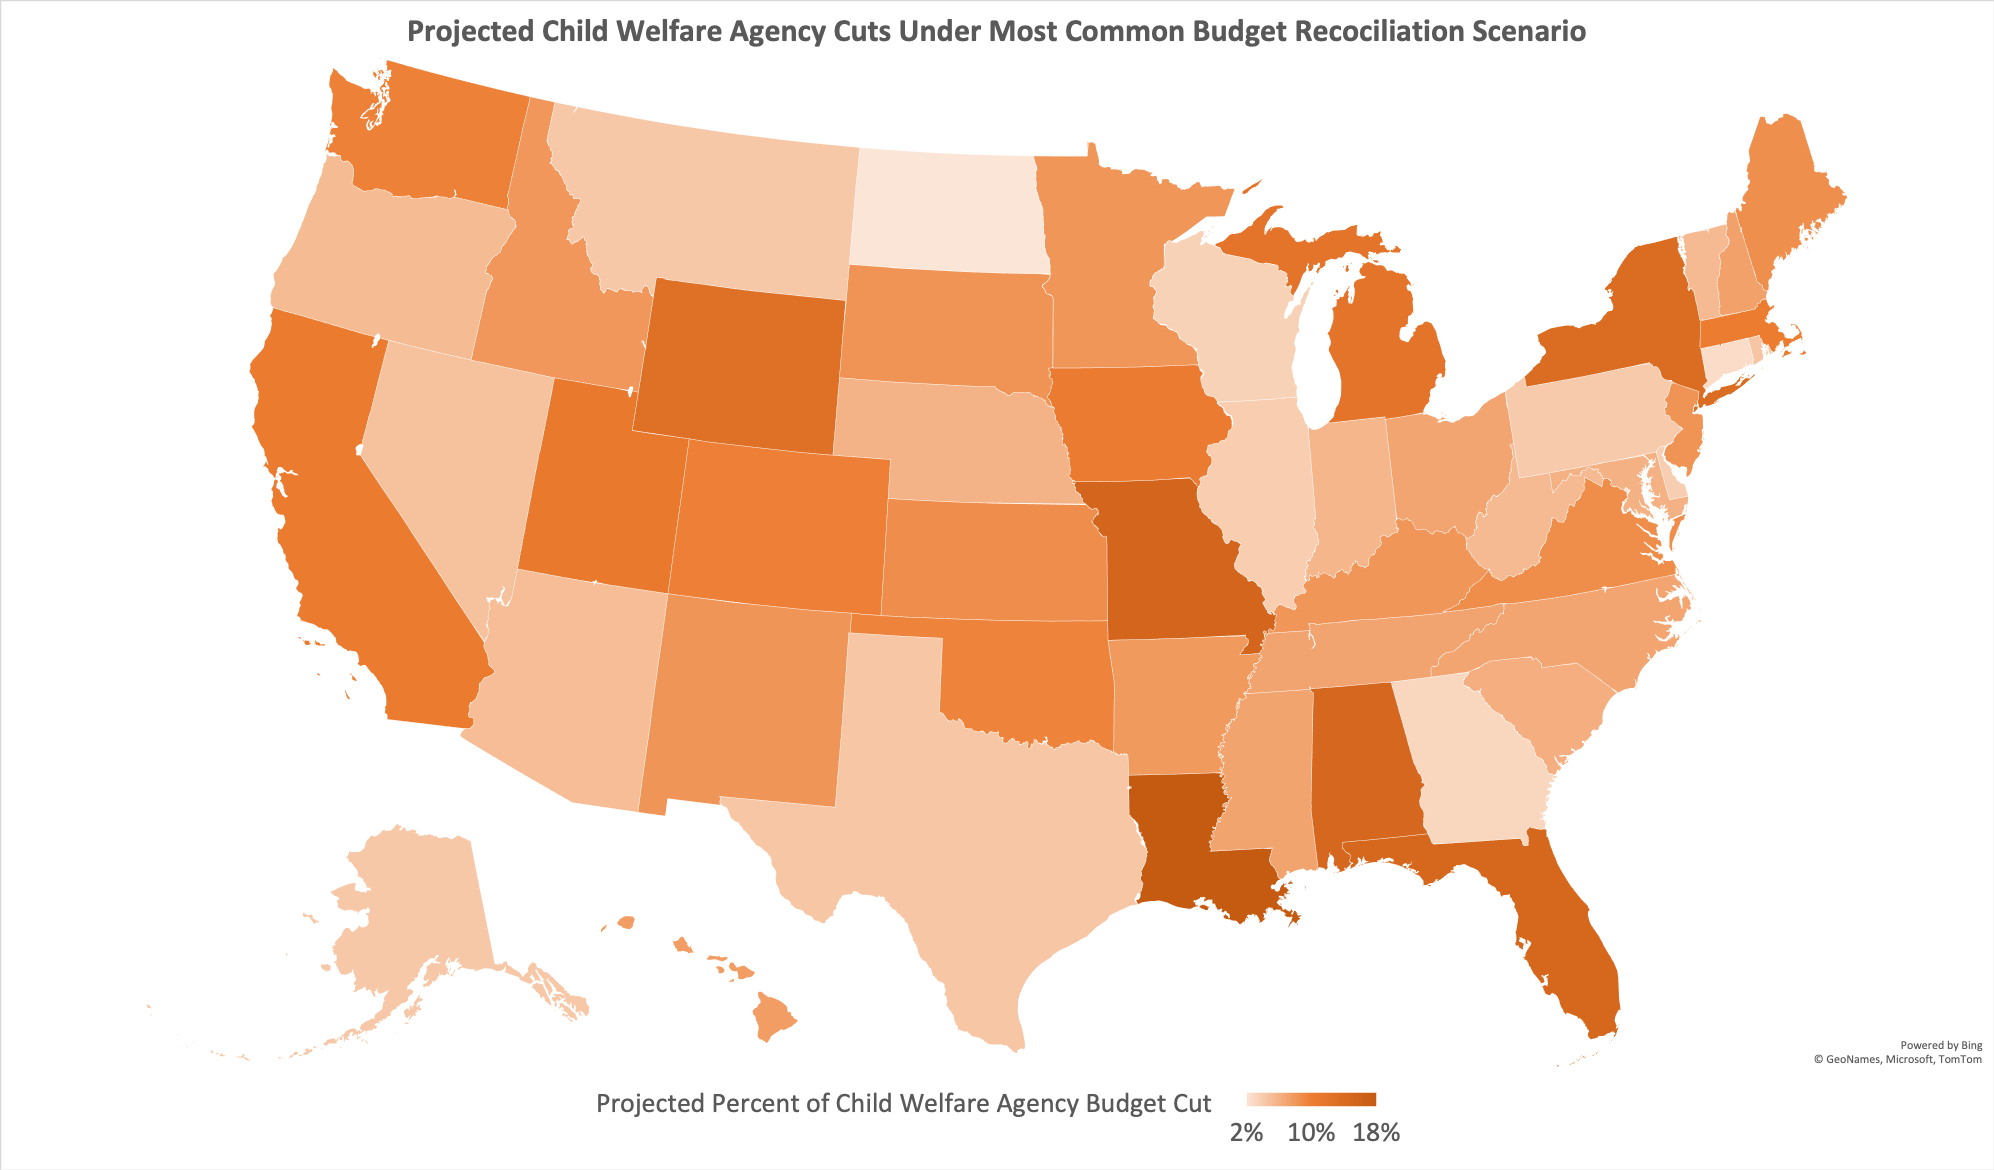
What We Found: Scale of State Cuts
BLUF Takeaway:
Child welfare agency cuts would average 7% nationally.
Child welfare agency cuts would range from 2% to 18%
13 states face cuts of 10% or larger.
Source of Cuts:
This map highlights the projected cuts nationwide.
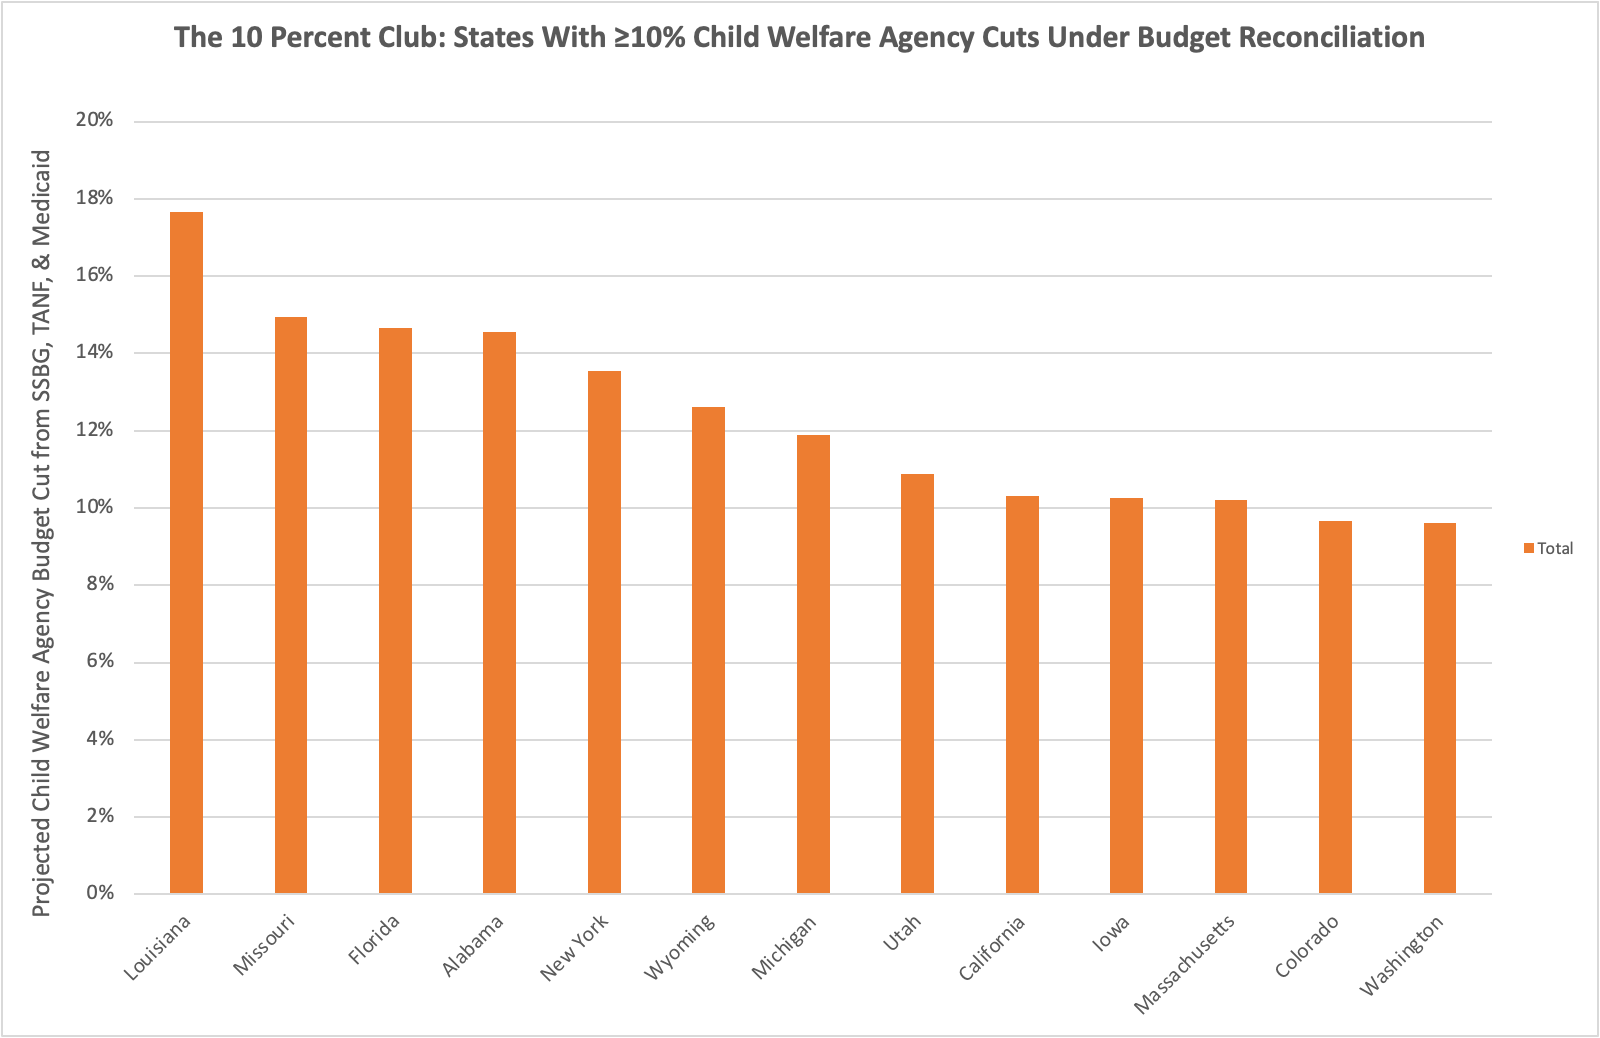
The 10 Percent Club
Of note, our analysis shows 13 states as members of the “10 Percent Club”, meaning they face child welfare agency cuts of 10% or more under this projection.
This first chart breaks down the total cut each of these states face.
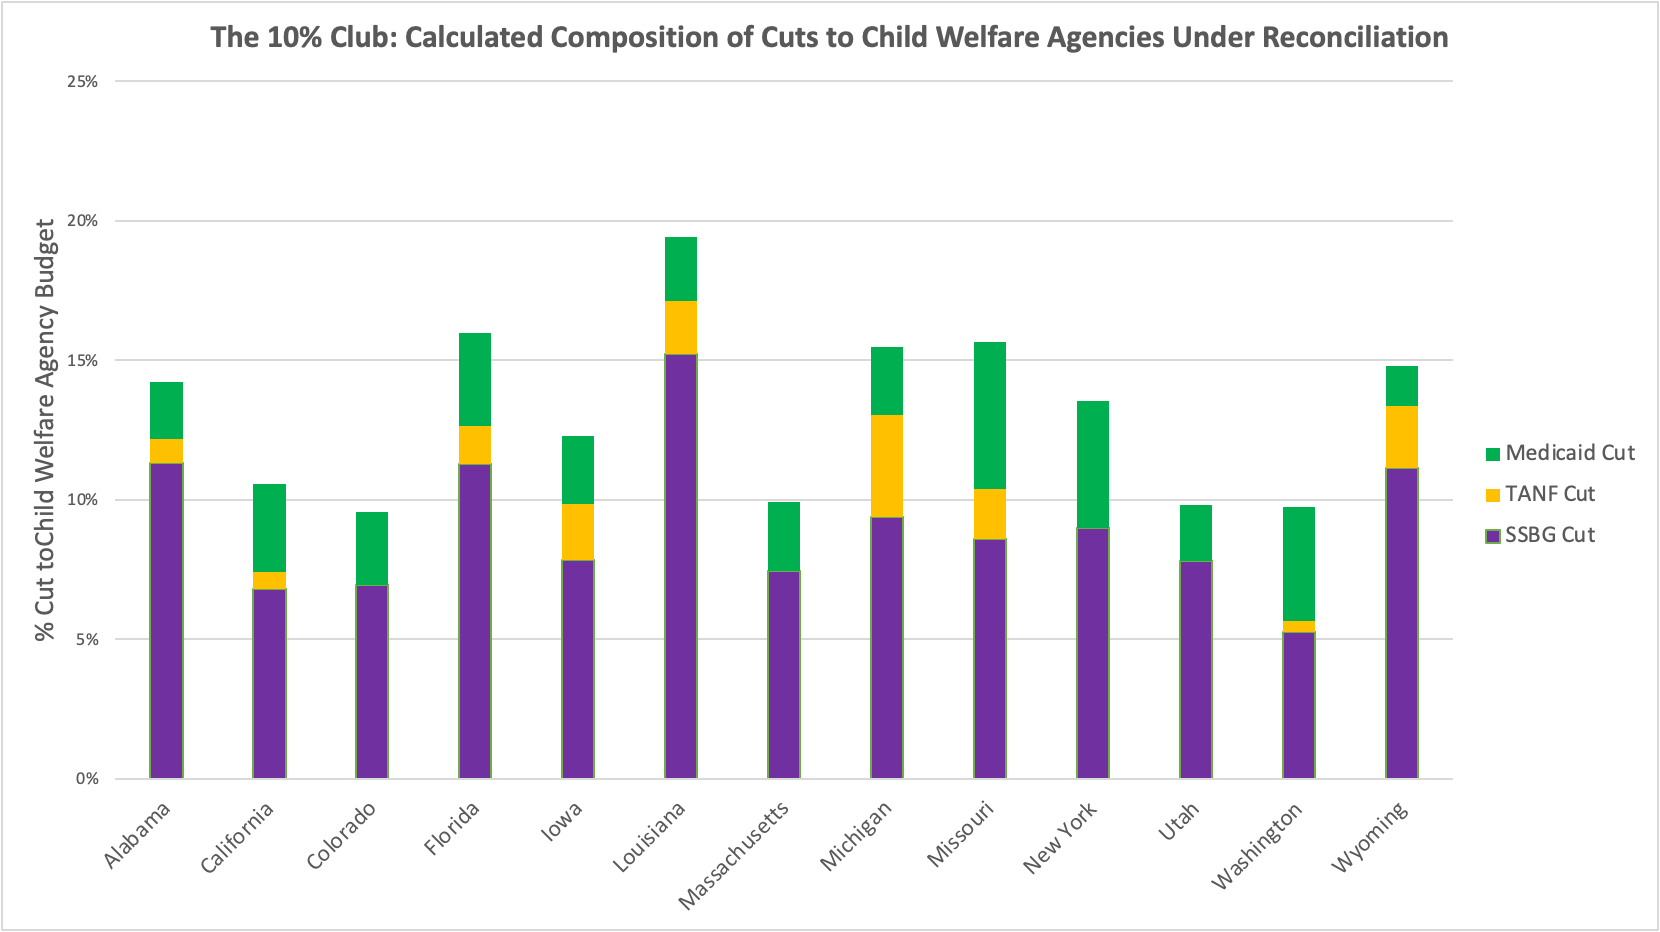
To dig deeper and because states’ vulnerabilities to these cuts vary, we also broke out the components of each state’s total cut.
This chart shows the same 10 Percent Club, showing not just its total cut but also how much of it specifically comes from SSBG, TANF, and Medicaid.
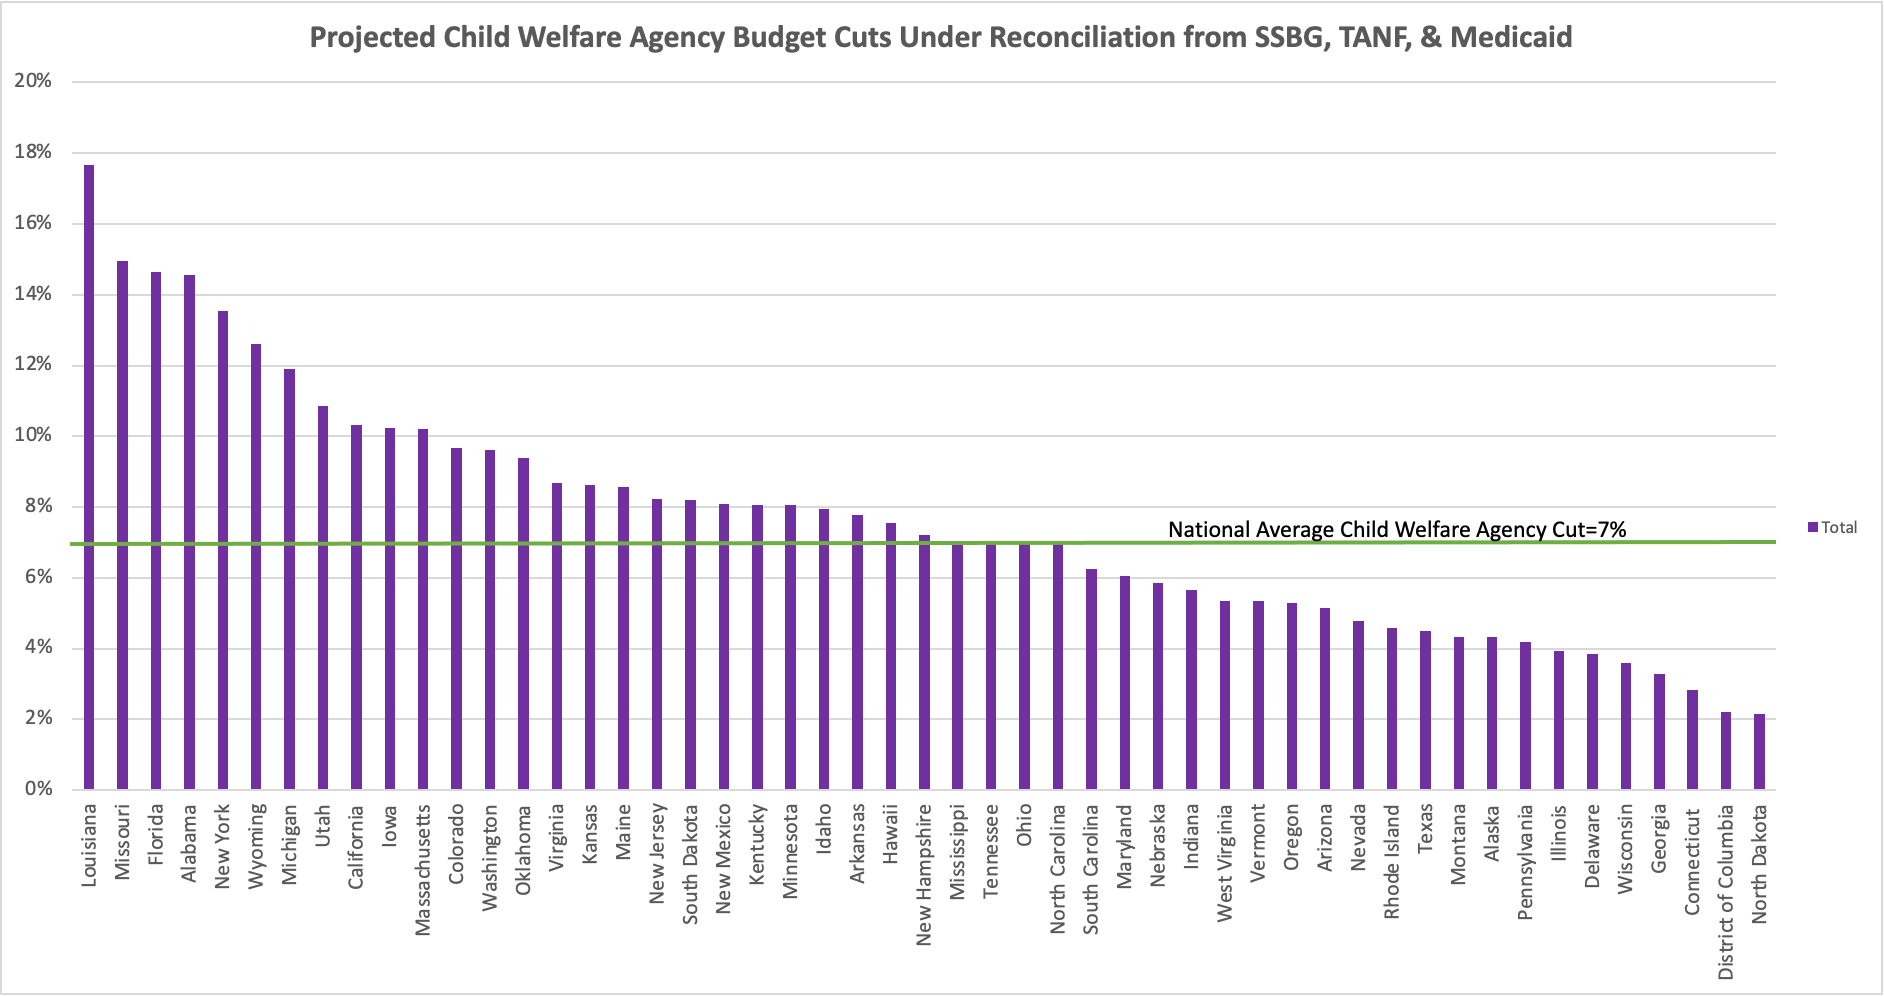
Projected Cuts to All States
This chart provides the projected total child welfare agency cut to all states under current reconciliation. It also benchmarks to the national average cut.
States Disproportionately Reliant On SSBG, TANF, & Medicaid
We know that as reconciliation continues, the composition of total possible funding cuts child welfare agencies face will change.
As negotiations continue, we will keep updating this modeling. In the meantime, we also will offer insight into which states have the greatest reliance on each program.
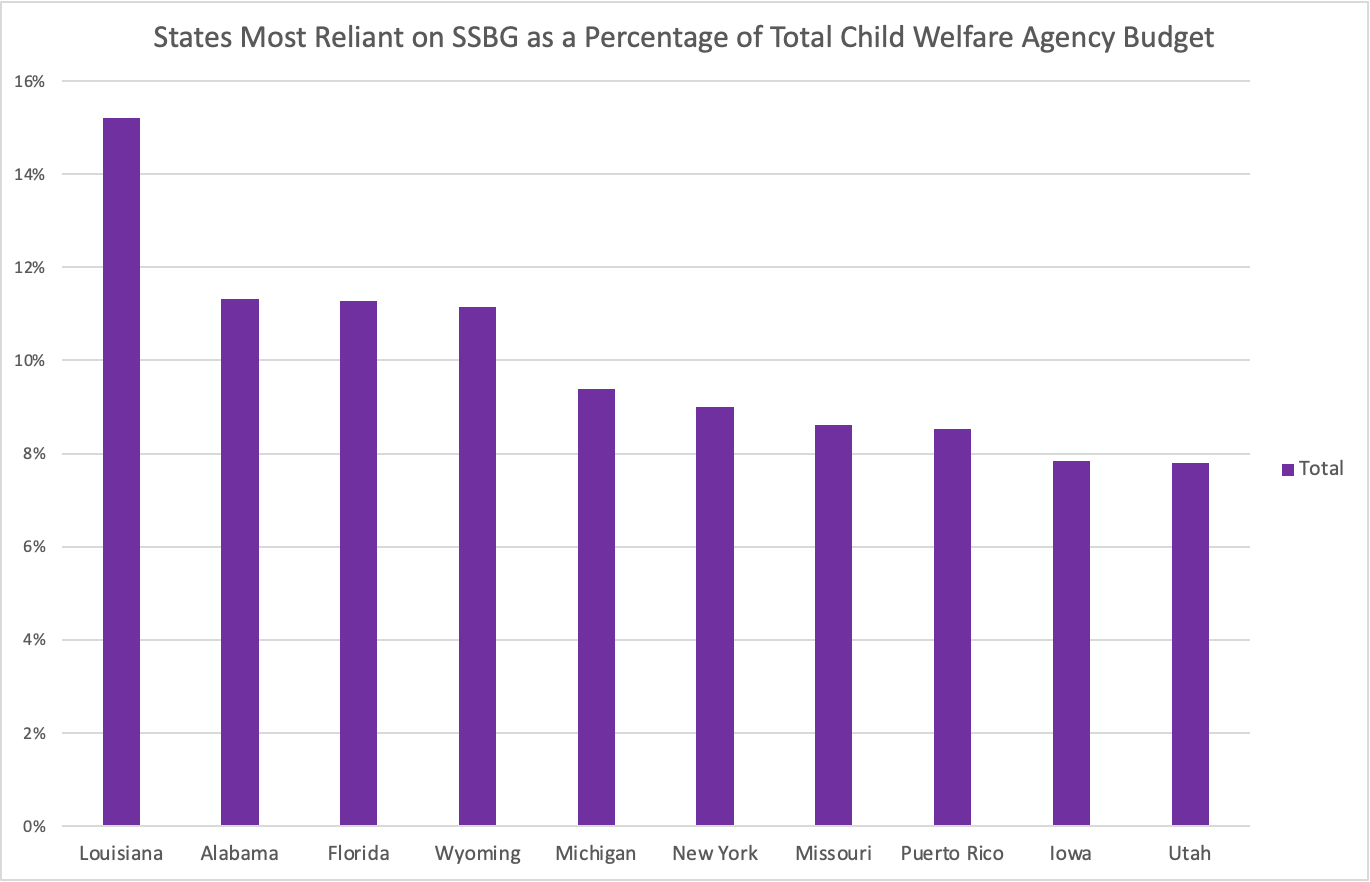
This first chart shows the 10 states most reliant on SSBG as a percentage of their total child welfare agency budget.
If reconciliation were to not cut SSBG, these states would disproportionately benefit. If it does cut SSBG, our projections show them as the most vulnerable to that cut.
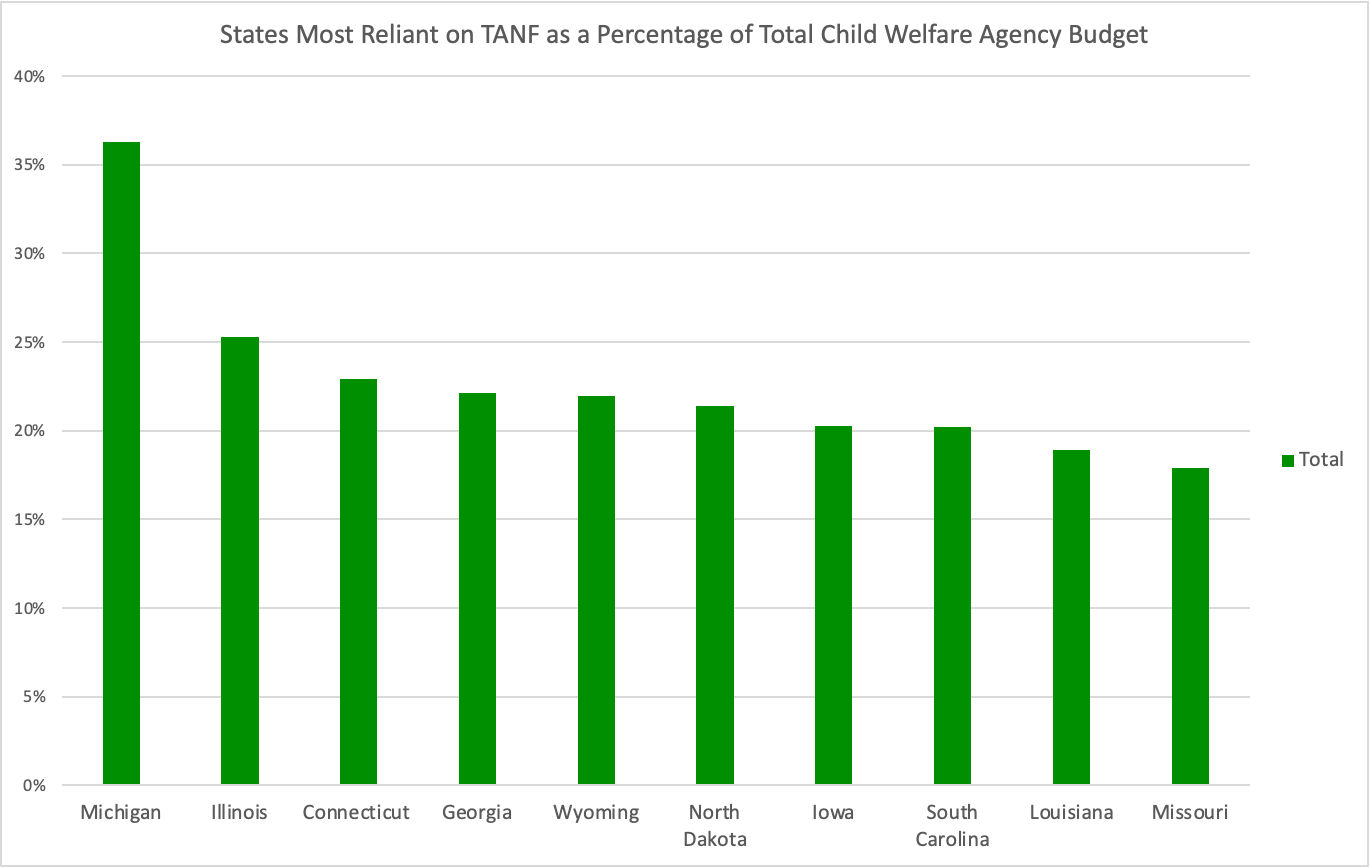
Next up is the 10 states most reliant on TANF as a percentage of their total child welfare agency budget.
If reconciliation were to not cut TANF, these states would disproportionately benefit. If it does cut TANF, our projections show them as the most vulnerable to that cut.
It’s worth noting that TANF faces further federal scrutiny that compounds this risk.1
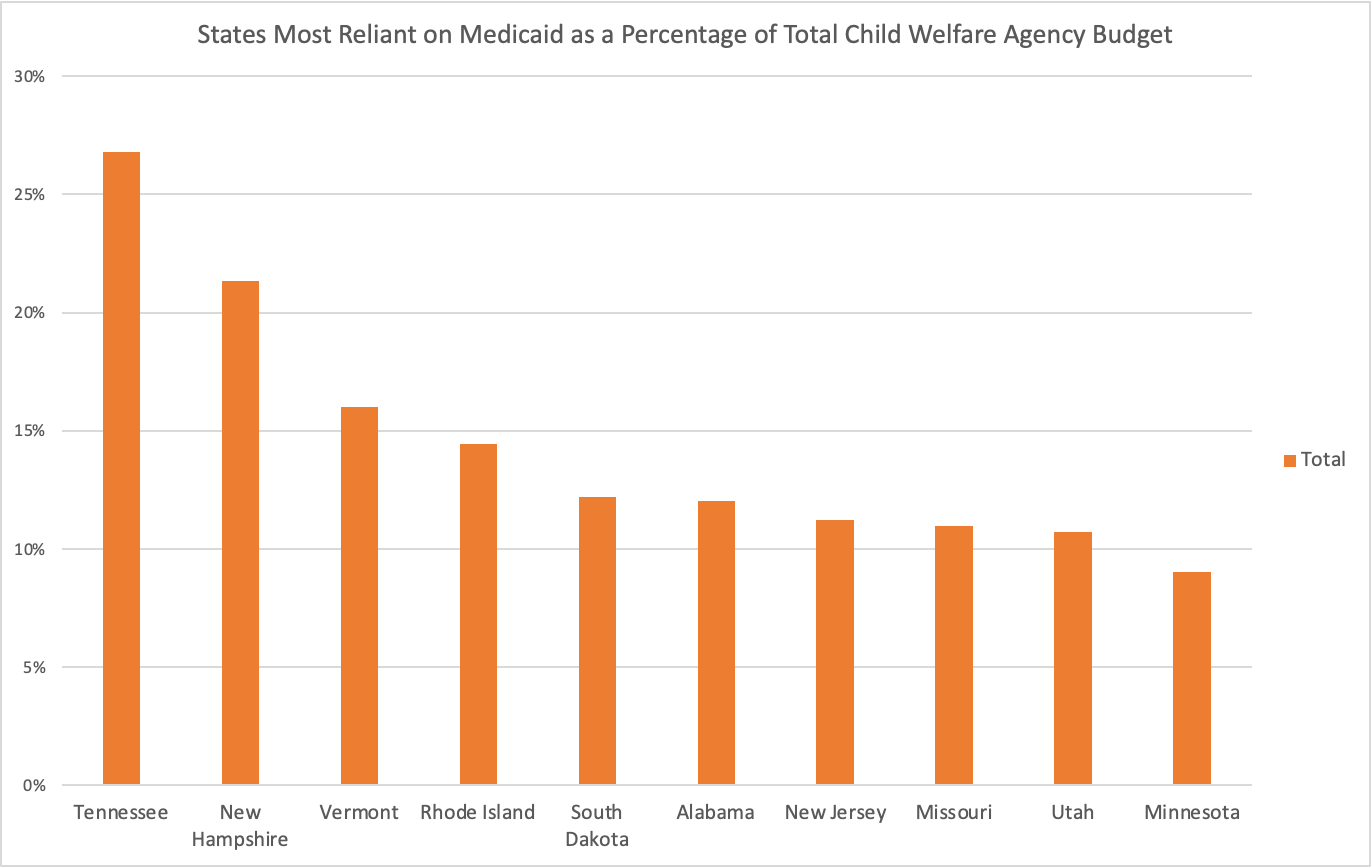
Next up is the 10 states most reliant on Medicaid as a percentage of their total child welfare agency budget.
This one is less straightforward; it only accounts for Medicaid spending by the child welfare agency. That is a significant undercount of Medicaid’s role in child welfare.
But it’s still important, and tells us states with likely additional risk exposure to any reductions in reconciliation.
Taken together, these three charts give a glimpse of how changes in reconciliation during negotiations may change our projections. Stay tuned for more.
Key Questions This Analysis Raises
There are many things this modeling cannot project. There are also further analyses and decisions others will face that this can inform. These include:
What would the projected budget reductions in this model look like if applied to a current child welfare agency budget?
How would the impact of these cuts change based on current and future projected foster care and prevention caseloads?
How would cuts to Medicaid impact child welfare agencies’ prevention services?
How would these reductions affect on entries to and exits from foster care?
In what ways would reductions of this nature change implementation of the recent bipartisan reauthorization of Title IV-B of the Social Security Act?
Does your state have its own recent policy reforms that these cuts would impact?
Sources and Methods
For those who want to go under the hood, this offers a detailed rundown of how we built our projection model, the assumptions we used, and how we analyzed the data.
This projection uses a conservative methodology that intentionally errs on the side of undercounting potential cuts. We used the following data sources and assumptions.
Data Sources:
ChildTrends Child Welfare Financing Survey
The biennial Child Welfare Financing Survey from ChildTrends offers important insights because it differentiates federal from state/local spending.
Missing data are inevitable in any survey.2 More flexible federal funds also often fill budget gaps, so variability in their role can change significantly year-to-year.
Our model is designed to mitigate these aspects of the data. We created a new combined dataset to smooth variability and develop more stable estimates.
We did this by using data from the three most recent surveys, lessening variability and giving us a more stable base from which to make projections.
How We Used It:
We used these figures to determine total reported child welfare agency spending across the three surveys.
We also measured total reported SSBG and TANF spending by state.
Based on those figures we determined the percentage of child welfare agency spending that SSBG and TANF represented over the three surveys.
This was our basis for SSBG and TANF cuts:
For SSBG we used its percentage of the budget, since it faces elimination.
For TANF we used 10% of its budget percentage, to reflect the likely cut.
These are likely undercounts:
Given the broader impact these cuts will have on other aspects of state budgets, they could reasonably lead to broader budget rebalancing.
They do not reflect any synergistic effect when combined with Medicaid cuts;
Reduced coverage could reasonably lead to higher demand for social services at the moment that their funding also decreases.
For these reasons, we believe this combined data set is the best possible publicly available tool to conservatively project the scope of possible cuts.
Sources:
KFF Medicaid Cut Analysis
KFF recently provided an analysis of the Medicaid reduction each state would see with a reconciliation cut of $880B over ten years.
How We Used It:
We used these figures to assume the Medicaid cut each state would face.
These totals were the numerator to calculate cuts as %s of total state budgets.
Assuming such a shortfall would spread beyond Medicaid is reasonable:
Medicaid is over half of all federal funding to states and the largest category of total state spending.3
Accordingly, Medicaid cuts would have implications beyond Medicaid itself.
A reasonable projection would be across-the-board cuts to all state agencies.
We used the percentage of each state’s budget that Medicaid represents to derive this cut, which we added to the SSBG and TANF cuts.
Sources:
National Association of State Budget Officers 2024 State Expenditure Report
Our figures for state budgets come directly from the states themselves; we used the most recent report from the National Association of State Budget Officers.
How We Used It:
We need a conservative estimate of total state budget impact for Medicaid cuts.
To ensure accuracy, we used FY 2023 data from this report.
We did this because the FY 2024 data are projections, and we wanted to use actual spending data to avoid inaccuracies.
This figure was the denominator we used to estimate what percent of state budgets the Medicaid cut would implicate.
This is like a significant undercount:
This does not assess the impact of lost coverage on acuity of need and state-covered indigent care costs.
It does not reflect Medicaid spending state child welfare agencies report;
While we have those figures from ChildTrends, trying to include them here would risk double counting them.
It does not reflect potential increases to state borrowing costs;
Recent credit rating agency analyses4 have noted that given the proportion of state budgets Medicaid represents.
They project that significant reductions could lead to credit downgrades.
Downgrading of state bonds would create higher state borrowing costs.
Combining these figures with the KFF analysis provides us with a conservative ability to estimate the likely impact to state child welfare agency budgets.
Sources:
Key Projection Assumptions:
All projections of this nature rely on assumptions. Child Welfare Wonk used these:
Total budget reconciliation spending reductions of at least $1.5T
Senate and House approaches and instructions continue to differ.
This figure has consistently been at the lower end of cuts needed absent an agreement that essentially obviates the need for cuts.
Our model is designed to accommodate updates to this figure; as Congress makes new decisions, we will update our projections.
Elimination of SSBG
Ever since the U.S. House Budget Committee memo first outlining possible spending reduction targets, SSBG elimination has been a discussion.
Current reconciliation instructions would still accommodate this cut.
A 10% TANF Cut
Ever since the U.S. House Budget Committee memo first outlining possible spending reduction targets, a 10% TANF cut has been a discussion.
Given the breadth of recent administrative oversight action highlighting concerns with TANF, this is likely an undercount of possible reductions.
A cut of $880B to Medicaid over 10 Years.
Multiple reconciliation proposals have included instructions to the U.S. House Energy and Commerce Committee to generate savings of at least $880B over ten years.
This is a floor rather than a ceiling, and multiple policymakers have called to increase this to significantly larger reductions.
The non-partisan Congressional Budget Office has noted that Medicaid represents 93% of relevant spending within that committee’s jurisdiction.
Based on all of this, independent health policy analysis organization KFF has based its projections for Medicaid reductions on $880B over ten years.
We are aware that many different proposals are also under discussion.
We began with this estimate, and will refine it as policymakers make formal decisions that refine their proposals.
A conservative application of Medicaid cuts to child welfare agency budgets.
Child welfare agencies rely significantly upon Medicaid. Among the many ways that it serves the agency’s population are that it covers:
99% of children in care;
Children with special needs adopted from foster care;
Youth who age out of foster care to age 26;
Mental health and substance use disorder treatment for parents to prevent foster care;
7% of all federal spending by child welfare agencies, not including coverage, for services the agencies directly provide.
The breadth of this impact is challenging to calculate accurately.
SSBG and TANF spending that is relevant to child welfare is more likely to be directly reflected in the child welfare agency budget, unlike Medicaid.
This means that while measuring those in ChildTrends data is more straightforward, this approach is an exponential undercount for Medicaid.
Our approach assumes across-the-board state budget cuts, based on the percent of each state’s budget that their projected Medicaid cut equals.
As noted above, this is likely a significant undercount, intentionally.
We did that to create projections in a data-driven defensible manner.
Methods
Analyzing these data and using these assumptions, we built out a projection of the cuts under budget reconciliation. This was our approach:
Using ChildTrends data we measured total reported agency spending over three years, with SSBG and TANF broken out.
Based on those figures we determined the percentage of child welfare agency spending that SSBG and TANF represented over the three surveys.
This was our basis for SSBG and TANF cuts:
For SSBG we used its percentage of the budget, since it faces elimination.
For TANF we used 10% of its budget percentage, to reflect the likely cut.
We used KFF data to assume the Medicaid cut each state would face, and NASBO data to benchmark that cut to the most recent actual budget.
Using KFF’s projected cuts as our numerator and the NASBO FY23 state budgets as our denominator, we found the % cut to each state’s budget.
Assuming those Medicaid cuts became across-the-board cuts to all state agencies, we added that to the SSBG and TANF cuts.
This gave us our total projections, including nationally and for each state.
Limitations
Any budgetary projection will have limitations. Ours include that we:
Cannot estimate the dollar value of cuts for state budgets;
Likely underestimate cuts to child welfare agencies, particularly Medicaid;
While our ChildTrends data show Medicaid spending, we had to exclude that from our cut projections and rely on other sources;5
Have to rely upon multiple datasets for the figures we need; and
Rely upon state data that are delayed and cannot capture most recent figures.
Thanks for reading, wonks, and I look forward to hearing what questions this analysis raises for you and what more you know about your own state that can refine it.
Most notably, CA and WY did not report state spending data in SFY2020. Given relative sizes, this is most salient for CA. Including two more years of survey data help buffer that.
See e.g. this from S&P Global
Including them here would create a data endogeneity issue, where we would risk counting the Medicaid cuts multiple times over.